After conducting a multicriteria rating session, you can analyze the breakdown of ratings by criterion for each evaluated alternative and assess the level of consensus among raters.
Viewing Average Ratings by Criterion
If the results of the rating session are made available, attendees can view individual statistics and charts for each card. To do this, click on a card to open it and view the charts on the right.
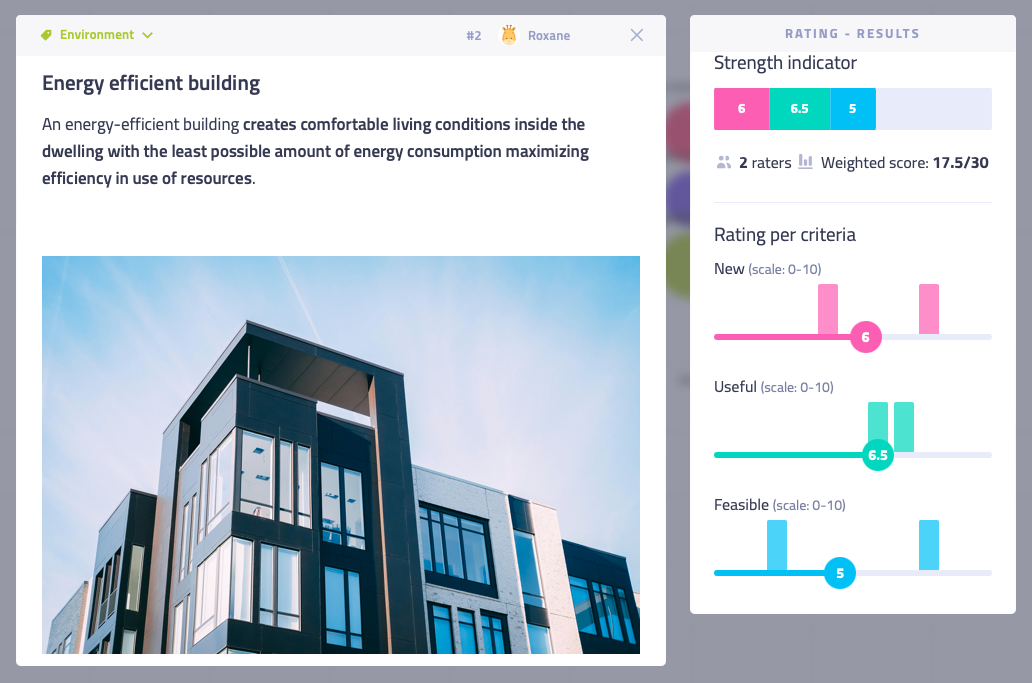
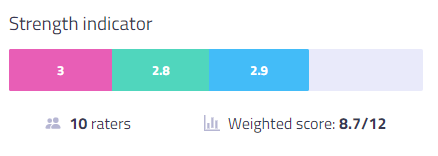
Strength Indicator Chart
The strength indicator displays the following information:
- How well an idea performed across different criteria
- The card's weighted score compared to the maximum possible score
- The number of attendees who rated the card
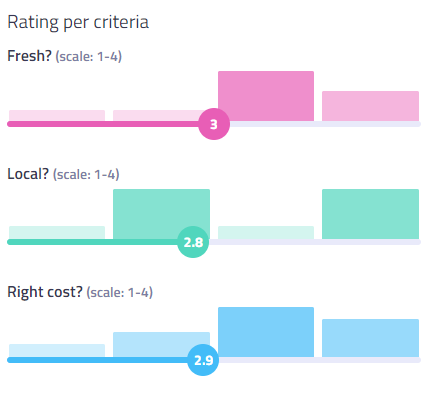
Ratings per Criterion Chart
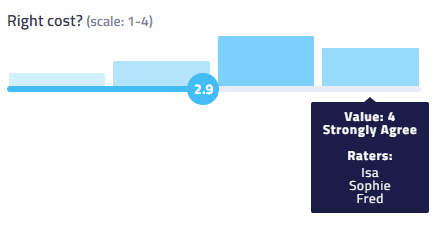
For each criterion, a chart shows both the average ratings (displayed as a colored bubble) and the distribution of user ratings (displayed as bars). This helps you gauge consensus among participants.
Facilitator Only: When hovering over a bar with your cursor, the facilitator can view the pseudonyms of the first five people who submitted ratings with that value.