To display the results of the current vote session as a bar chart, follow these steps:
- Click on the Display menu in the facilitator bar.
- Select the BarChart tab.
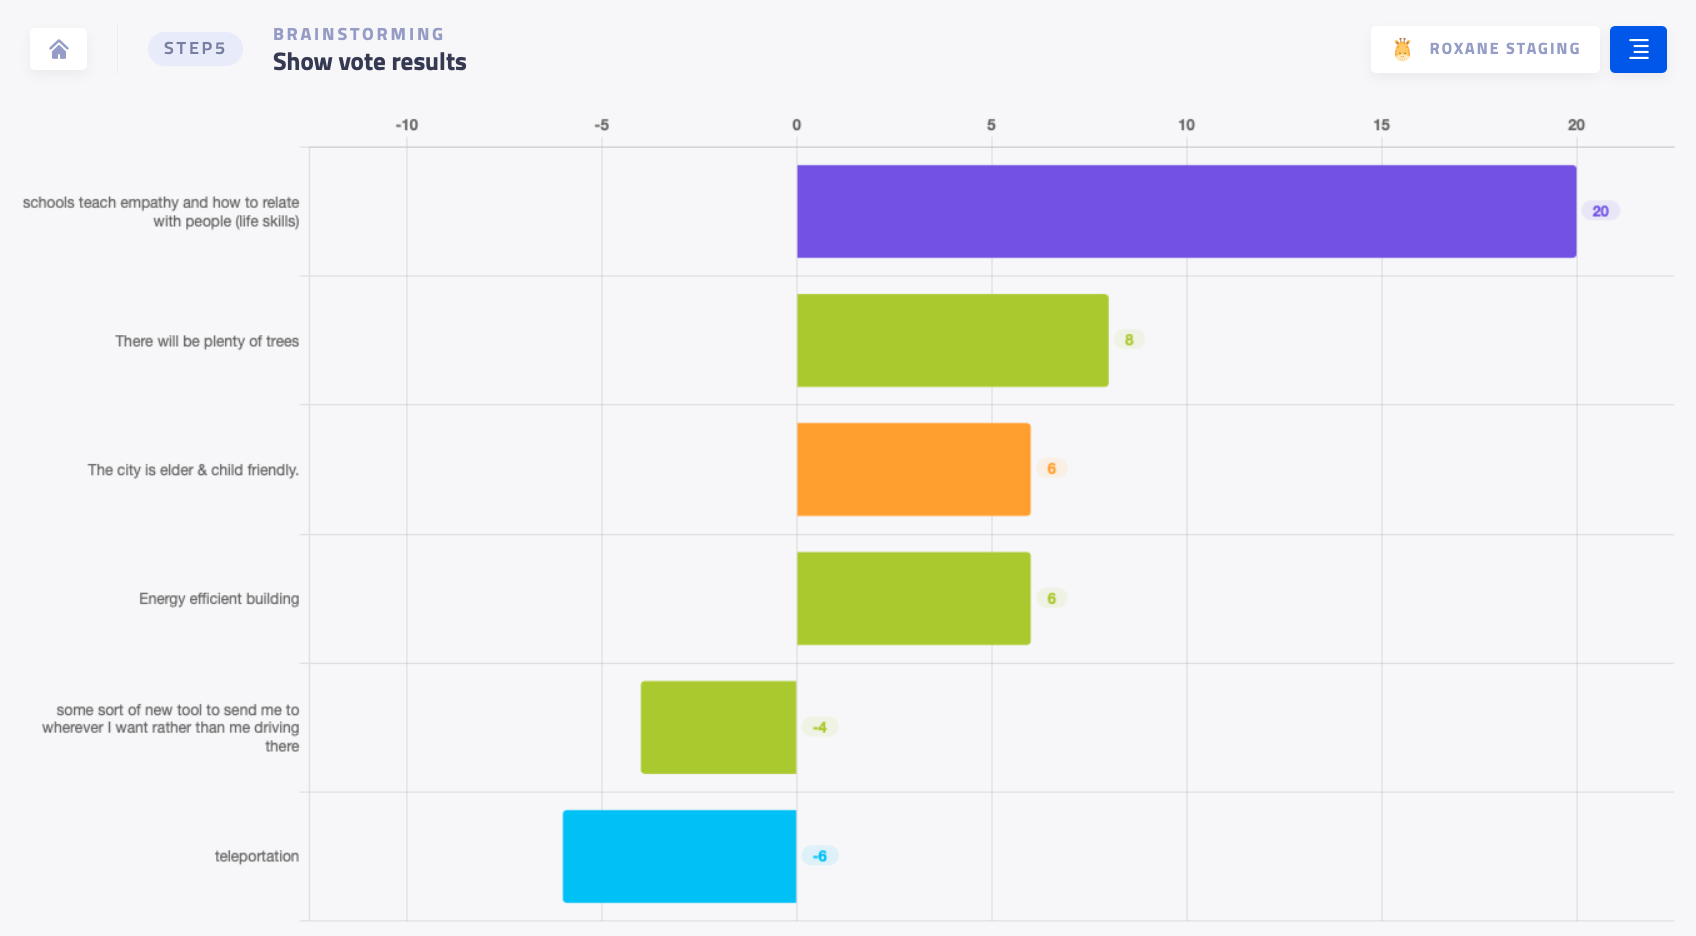
The bar chart will display the following information:
- The sum of negative points allocated by all participants
- The sum of positive points allocated by all participants
- The final score of each card (the sum of positive and negative points)
Note: Stormz displays the results of the vote session associated with the current step. It is not possible to display results from multiple vote sessions at the same time.
Troubleshooting
If you have completed a vote session and want to display the bar chart, but the message "There must be at least one vote on a card to display the bar chart" appears, it may be because you have not selected the correct vote session to display in the current step. To fix this, follow these steps:
- Open the step sidebar
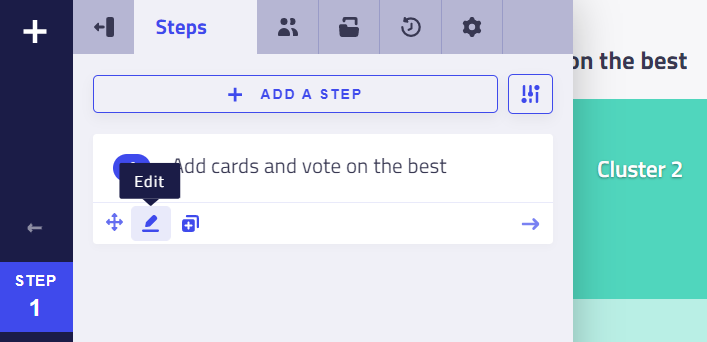
- Edit the step that will be assigned the vote session
- Scroll down to the vote settings section
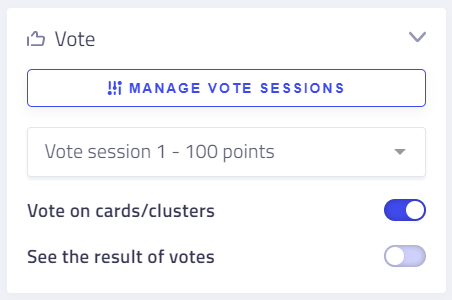
- In the dropdown menu, select the correct vote session.
- Click Save to apply your changes.
⚠️ Note: Don't forget to click Save to apply your changes.